Сығанаҡ файл ((1064 × 1006 пиксель, файл күләме: 55 КБ, MIME-төр: image/png))

Тасуирлау
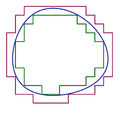
English: A set (represented in the picture by the region inside the blue curve) is Jordan measurable if and only if it can be well-approximated both from the inside and outside by simple sets (their boundaries are shown in dark green and dark pink respectively).
Көнө
Сығанаҡ Шәхси эш
Автор User:Oleg Alexandrov


Ҡыҫҡа аңлатма

Made by myself with Matlab.

Public domain Мин, был хеҙмәткә авторлыҡ хоҡуҡтары эйәһе, уны йәмәғәт милкенә ҡулланыуға тапшырам. Был рөхсәт бөтә донъяла ғәмәлдә.
Ҡайһы бер илдәрҙә был хоҡуҡи йәһәттән мөмкин булмауы ихтимал; был осраҡта:
Әгәр улар ҡанун буйынса талап ителмәһә, мин һәр кемгә был хеҙмәтте төрлө маҡсаттарҙа бер ниндә шарттарһыҙ ҡулланырға рөхсәт итәм.

Лицензиялау

Public domain Мин, был хеҙмәткә авторлыҡ хоҡуҡтары эйәһе, уны йәмәғәт милкенә ҡулланыуға тапшырам. Был рөхсәт бөтә донъяла ғәмәлдә.
Ҡайһы бер илдәрҙә был хоҡуҡи йәһәттән мөмкин булмауы ихтимал; был осраҡта:
Әгәр улар ҡанун буйынса талап ителмәһә, мин һәр кемгә был хеҙмәтте төрлө маҡсаттарҙа бер ниндә шарттарһыҙ ҡулланырға рөхсәт итәм.

Source code (MATLAB)

function main()

   % the function whose zero level set and inner and outer approximations will be drawn
   f = inline('60-real(z).^2-1.2*imag(z).^2-0.006*(real(z)-6).^4-0.01*(imag(z)-5).^4', 'z');
   
   M=10; i=sqrt(-1); lw=2.5;
   figure(1); clf; hold on; axis equal; axis off;
   
   if  1==0
      for p=-M:M
	 for q=-M:M
	    z=p+i*q;
	    if f(z)>0
	       plot(real(z), imag(z), 'r.')
	    else
	       plot(real(z), imag(z), 'b.')
	    end
	 end
      end
   end
   
% draw the zero level set of f
   h=0.1;
   XX = -M:h:M; YY = -M:h:M;
   [X, Y] = meshgrid (XX, YY); Z = f(X+i*Y);
   [C, H] = contour(X, Y, Z, [0, 0]);
   set(H, 'linewidth', lw, 'EdgeColor', [0;0;156]/256);
   
% plot the outer polygonal curve
   Start=5+6*i; Dir=-i; Sign=-1; 
   plot_poly (Start, Dir, Sign, f, lw, [139;10;80]/256);
   
% plot the inner polygonal curve
   Sign=1; Start=4+5*i; 
   plot_poly (Start, Dir, Sign, f, lw, [0;100;0]/256);
   
%  a dummy plot to avoid a matlab bug causing some lines to appear too thin
   plot(8.5, 7.5, '*', 'color', 0.99*[1, 1, 1]);
   plot(-4.5, -5, '*', 'color', 0.99*[1, 1, 1]);
   
   saveas(gcf, 'jordan_illustration.eps', 'psc2');

function plot_poly (Start, Dir, Sign, f, lw, color)

   Current_point = Start;
   Current_dir   = Dir;

   Ball_rad = 0.03;
   
   for k=1:100
      
      Next_dir=-Current_dir;

      % from the current point, search to the left, down, and right and see where to go next
      for l=1:3
	 Next_dir = Next_dir*(Sign*i);
	 
	 if Sign*f(Current_point+Next_dir)>=0 & Sign*f(Current_point+(Sign*i)*Next_dir) < 0
	    break;
	 end
      end
      
      Next_point = Current_point+Next_dir;

      plot([real(Current_point), real(Next_point)], [imag(Current_point), imag(Next_point)], 'linewidth', lw, 'color', color);

      round_ball(Current_point, Ball_rad, color'); % just for beauty, to round off some rough corners
      
      Current_dir=Next_dir;
      Current_point = Next_point;

   end


function round_ball(z, r, color)
   x=real(z); y=imag(z);
   Theta = 0:0.1:2*pi;
   X = r*cos(Theta)+x;
   Y = r*sin(Theta)+y;
   Handle = fill(X, Y, color);
   set(Handle, 'EdgeColor', color);
Эту математическую иллюстрацию желательно воссоздать или аккуратно преобразовать в векторный формат SVG. Это даёт несколько преимуществ, прочитать о которых подробнее вы можете на странице Commons:Media for cleanup. Если вам уже сейчас доступна векторная версия данного изображения, загрузите её, пожалуйста, а затем замените этот шаблон на следующий: {{Vector version available|Имя загруженного файла.svg}}.

Краткие подписи

Добавьте однострочное описание того, что собой представляет этот файл
A set ( the region inside the blue curve) is Jordan measurable if and only if it can be well-approximated both from the inside and outside by simple sets (their boundaries are shown in dark green and dark pink respectively).

Элементы, изображённые на этом файле

һүрәтләнгән объект

Файл тарихы

Файлдың күрһәтелгән ваҡытта ниндәй өлгөлә булғанын ҡарар өсөн баҫығыҙ: Дата/ваҡыт

Дата/ваҡытМиниатюраҮлсәмдәреҠатнашыусыИҫкәрмә
ағымдағы17:27, 4 февраль 200717:27, 4 февраль 2007 өлгөһө өсөн миниатюра1064 × 1006 (55 КБ)Oleg AlexandrovMade by myself with Matlab. {{PD}}
17:24, 4 февраль 200717:24, 4 февраль 2007 өлгөһө өсөн миниатюра1064 × 1006 (55 КБ)Oleg AlexandrovMade by myself with Matlab. {{PD}}

Был файлды киләһе 2 биттәр ҡуллана:

Файлды глобаль ҡулланыу

Был файл түбәндәге википроекттарҙа ҡулланыла: